Did your commute get worse in 2022? Overall, congestion cost the country more than $81 billion, says transportation data company Inrix. It just published its Global Traffic Scorecard for the past year, and the data says the typical US driver spent 51 hours in traffic last year, 15 hours more than in 2021. And due to increased fuel prices and other inflation, the average driver paid $134 more for fuel last year than the year before—and that's in addition to $869 in lost time.
Although it's not as severe as it was in 2020 or 2021, it's still possible to see the effect of the pandemic in Inrix's data. In the US, vehicle miles traveled (VMT) increased by 1 percent year on year, but we still drove 9 percent fewer miles per year than before the pandemic. Interestingly, Inrix says this is due to more people continuing to work from home, which it says now accounts for 17.9 percent of Americans—before the pandemic, work from home accounted for only 5.7 percent of workers, according to the US Census Bureau.
Sadly, road safety is still rather abysmal; the estimated fatality rate of 1.27 deaths per 100 million VMT is 17 percent higher than we saw in 2019, although there has been a slight reduction from 2021's high of 1.3 fatalities per 100 million VMT. And while some of the other trends found in the report exist in countries like the UK or Germany, the rise in road deaths appears to be unique to the US.
Inrix collects data on more than just car journeys, and when it comes to public transport, things are looking better than at any time since the start of the pandemic. COVID caused Americans to decrease their use of buses, trains, and trams by 50 percent, but in 2022, we gained back 33 percent of that loss with increased ridership. Overall, public transport usage in the US remains 39 percent down from 2019.
And while cycling became much more popular in Germany and the UK over the last couple of years, here in the US, that's not really happening. Bikeshare rentals in New York City and Washington, DC, have increased, but cities like Seattle and San Francisco have lost cyclists, attributed by Inrix to the work-from-home effect.
Your traffic is bad—London’s traffic is worse
In addition to looking at national trends, Inrix also scores cities around the world for congestion. And topping the chart yet again is London, up 5 percent year on year. The average speed driving in downtown London was just 10 mph, and the average Londoner lost 156 hours to congestion in 2022.
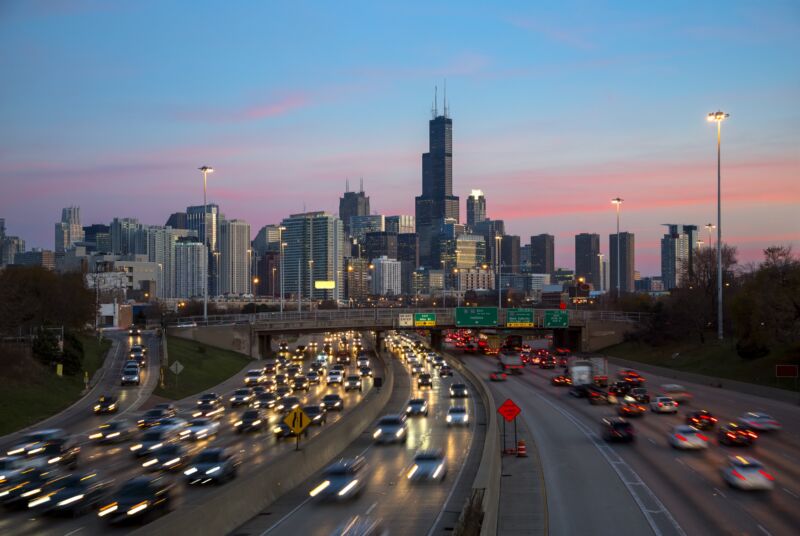
But things were nearly as bleak in Chicago, which jumped four spots to land in second place for 2022. Drivers in the Windy City wasted 155 hours in jams, an increase of 49 percent compared to 2021. Chicagoans can take solace that their average downtown speed is a whole mile an hour faster than it would be in London.
Paris takes the bronze medal, with residents spending 138 hours idling in traffic, a 1 percent decrease over last year. But the US can take pride in claiming spots 4 and 5, Boston and New York City, respectively. Boston saw a big jump—72 percent up on last year, for a grand total of 134 hours thrown away in jams. But New Yorkers fared a little better, with 117 hours sacrificed to congestion.
reader comments
208